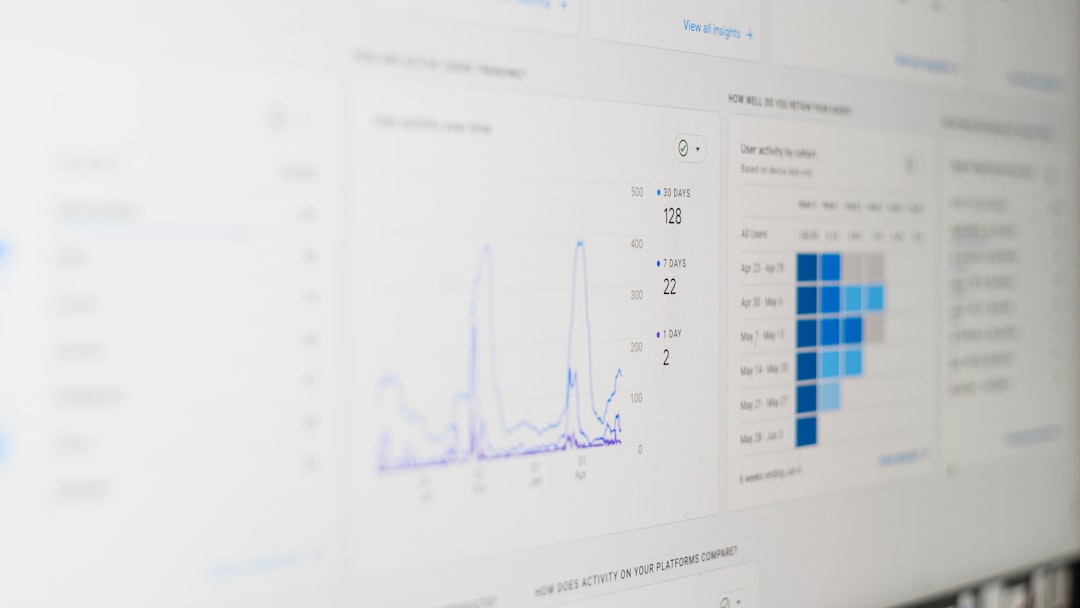
In 2025, Twitter—now officially rebranded as X—has grown well beyond its original microblogging roots. Today, it serves as an ecosystem for creators, brands, and businesses to build their identity and engage communities. With the ever-changing social media landscape, understanding how your content performs is more critical than ever. That’s where X Analytics come into play.
Whether you’re a content creator aiming to expand your reach, a business looking to boost ROI through social media, or simply a curious user wanting to improve your posts, mastering X Analytics is your secret weapon. This guide will walk you through how to access your analytics, what the key metrics mean, and how you can use this data to make smarter decisions in 2025 and beyond.
How to Access Your X Analytics
Accessing your analytics on X is straightforward, but it has evolved slightly since the Twitter days. Here’s how you can view them in 2025:
- Log into X.com with your account credentials.
- Click on your profile avatar in the upper right corner.
- From the dropdown menu, select Creator Studio or Analytics (depending on your account type).
Alternatively, you can visit analytics.x.com directly to open your dashboard. For power users and creators, having the dedicated X Studio app on mobile can also make tracking your metrics easier on the go.
Key Metrics To Understand
Once you’re inside your analytics dashboard, you’re greeted with a wealth of data. But don’t let that overwhelm you. Here are the core metrics you should be familiar with:
- Impressions: The number of times your post was shown on someone’s screen. High impressions mean good visibility.
- Engagements: How many interactions your content received—likes, reposts, comments, and shares.
- Engagement Rate: Percentage of engagements out of total impressions. This indicates how compelling your content is.
- Profile Visits: Number of times users clicked on your profile after viewing your post.
- Followers Gained: How many new followers you acquired over a specific timeframe.
- Click-Through Rate (CTR): If you shared a link, this shows how many users clicked on it. Highly important for marketing strategy.

Each of these metrics can give you unique insights into different facets of your content’s performance. The key lies in connecting these numbers to actual strategy.
How To Utilize Your Analytics Data
Checking your stats is just the beginning. Turning those numbers into action is where the real magic happens. Here’s how to make the most out of your X Analytics:
1. Identify Top-Performing Content
Use the Top Posts section of your dashboard to spot patterns among your best content. Ask yourself:
- What type of media was used? (Text, image, video, poll)
- What time was it posted?
- What hashtags or keywords were included?
Once you’ve identified the factors contributing to success, you can replicate and scale your strategies moving forward.
2. Understand Audience Demographics
In 2025, X provides advanced demographic breakdowns, including:
- Geographic location
- Interests and hashtags followed
- Device and browser usage
- Activity times and behavior patterns
This data can help you customize your content, post at optimal times, and engage audiences more effectively. For instance, if your follower base is largely active from 6 PM to 9 PM Eastern, time your crucial posts during that window.
3. Optimize for Engagement
If you notice that posts with images or polls consistently receive more engagement, this is your cue to use more of those formats. Additionally, interactive content helps boost your algorithmic ranking, which increases your visibility even further.

4. Measure Campaign Performance
Brands and creators often run specific campaigns, promotions, or collaborations. With X’s updated campaign tracking tools, you can:
- Set objectives (reach, engagement, conversions)
- Track performance against KPIs
- See which call-to-actions work best
This makes it easy to tweak your strategy mid-campaign rather than waiting till the end when it’s too late to adjust.
5. Track Growth Over Time
Using the longitudinal graphs in the analytics dashboard, you can track your account growth across months or even years. Look for:
- Spikes in activity and what caused them
- Periods of stagnation or decline
- Seasonal trends
Recognizing these patterns helps you prepare future content calendars more intelligently, capitalizing on recurring high-performance periods.
Setting Goals Based on Analytics
Having data is one thing—setting actionable goals is another. Here’s how you can set SMART (Specific, Measurable, Achievable, Relevant, Time-bound) goals using your X Analytics:
- Example 1: “Increase engagement rate to 3% by the end of next month by using more polls and Q&A threads.”
- Example 2: “Gain 500 new followers in 30 days by posting daily and utilizing trending hashtags.”
By linking your goals to specific metrics, you can continuously refine your approach and measure ROI over time.
Using Third-Party Tools for Deeper Insights
While X’s native analytics are robust, sometimes you need deeper or more customizable data. Tools that integrate with X in 2025 include:
- Sprout Social – Advanced scheduling and cross-platform analytics
- Hootsuite – Great for managing multiple accounts and generating detailed reports
- Metricool – Ideal for freelancers and solo creators with budget-friendly plans
- Brandwatch – Offers rich sentiment analysis and brand tracking
These tools often come with dashboards that can sync with Google Analytics, giving a more unified view of your digital presence.
Analytics for Monetization
Monetization features on X have expanded dramatically. In 2025, creators can access:
- Premium Subscriptions
- Tips and Donations
- Ad Revenue Sharing
Your analytics directly influence your earning potential. Consistently high engagement and follower growth make you more eligible for partner programs. Also, brands evaluating influencers often request analytics screenshots to verify reach and interaction quality.
Final Thoughts
In today’s connected world, posting blindly on social media no longer cuts it. If you’re serious about growing your presence on X, understanding and utilizing your analytics is non-negotiable. From identifying content strategies to setting measurable goals and refining performance, X Analytics opens a powerful window into what’s working—and what isn’t.
By combining strategic analysis with consistent experimentation, you’ll be able to transform passive posting into active growth. So log in, dig into your data, and let the numbers guide you toward better content, deeper engagement, and greater success.
 person analyzing data, computer screen, social media strategy[/ai-img>
